Reflection #4: The Digital Storytelling- Mapping with the Hyperlinked Library Center

The  Digital Storytelling of the Hyperlinked Library Center:

Digital storytelling mapping with the Hyperlinked library center is a process that involves using digital tools to create interactive maps that tell a story or convey information in a spatial context. These maps can incorporate multimedia elements such as images, videos, audio clips, and text to enhance the storytelling experience. By combining location-based data with storytelling techniques, digital storytelling mapping can provide a unique and engaging way to present information and connect with attending audiences with the hyperlinked library center.
Figure 1:  Hill, A. (2021, August 27). Stories in motion: How stories shape our relationship with space. https://www.storycenter.org/storycenter-blog//stories-in-motion-how-stories-shape-our-relationship-with-space (picture)
Four elements of digital storytelling in the Hyperlinked Library Center include:

Multimedia: The use of various media types, such as images, videos, audio, and text, to convey a story effectively.

Figure 2: Rawpixel.com. (2018, July 17). Free vector: Illustration of technology vector. Freepik. https://www.freepik.com/free-vector/illustration-technology-vector_2605721.htm

Narrative Structure: Crafting a compelling narrative that engages and guides the audience through the story.

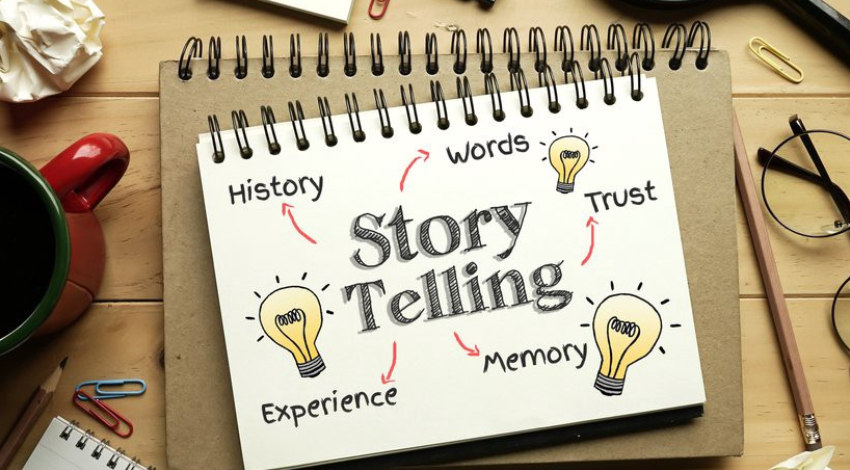
Figure 3: James. (2021, April 15). What is storytelling in simple terms? smC2018. https://www.smc2018.org/what-is-storytelling-in-simple-terms/

Interactivity: Allowing viewers to interact with the story by choosing different paths or outcomes.

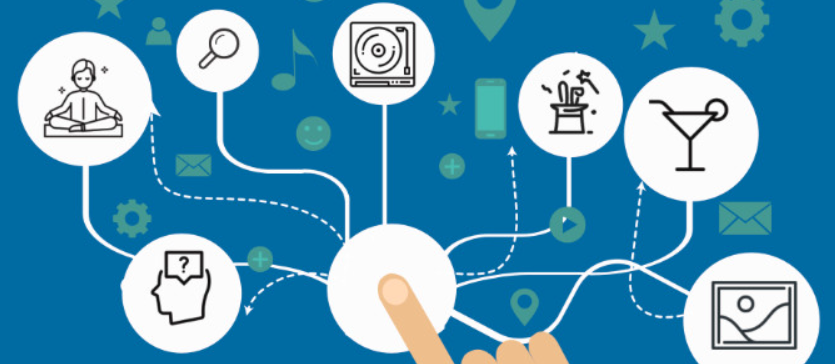
Figure 4:  Edgar, D. (2021, June 28). 7 interactivity pillars for virtual events. VenuIQ. https://venu-iq.com/7-interactivity-pillars-for-virtual-events/

Audience Engagement: Creating content that resonates with the audience on an emotional level and encourages participation and feedback. “StoryMap” is a powerful digital storytelling tool that allows users to create interactive maps with multimedia content. The Hyperlinked Library Center with StoryMaps enables storytellers to combine maps with narrative text, images, and videos to present visually engaging and spatially relevant information. Users can guide their audience through a journey by integrating location-based data with storytelling elements, providing context and depth to their narratives. StoryMaps are valuable for various applications, including educational projects, journalistic storytelling, cultural heritage preservation, and more. (below picture):

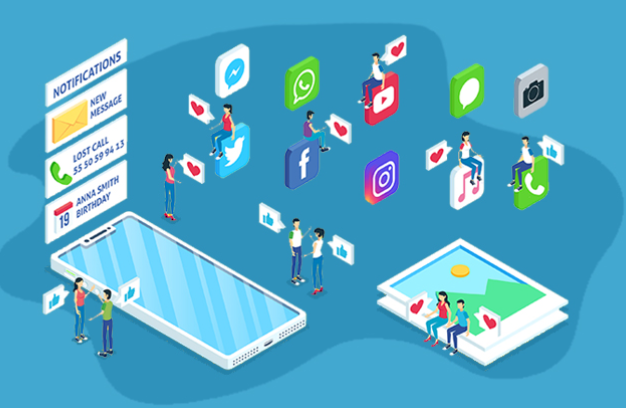
Figure 5:  Barkett, B. (2019, August 29). 10 ways to engage your audience and boost engagement. aimtell. https://aimtell.com/blog/10-ways-engage-audience-boost-engagement

The Reading storytelling mapping for the Hyperlinked Library Center has some exciting stories to tell by researchers, experts, and patrons:

Lambert assists storytellers in grasping the core elements of dynamic digital storytelling—from conceptualizing the narrative to crafting it and ultimately sharing it. In this fourth edition, readers will encounter fresh insights into the practical applications of digital storytelling alongside updated appendices offering valuable resources for aspiring digital storytellers. As I read the website, I found that the digital storytelling resources include details on past and ongoing projects associated with the Center for Digital Storytelling with the Hyperlinked Library and exploring place-based storytelling—a narrative engagement to comprehend experience and social media platforms.  Additionally, a companion website enriches the entire storytelling process. It will be the significant research in educators, librarians, businesses, artists, and writers who are engaging in endeavors that have modernized the perspectives of community activists, educators, health and human services agencies, business professionals, and artists regarding storytelling, media, culture, and the influential role of personal voice in effecting change. For those eager to embark on the journey of multimedia storytelling, “Digital Storytelling” serves as an essential starting point(Lambert, 2018).

As I reflect upon reading the journey stories, I begin with the researcher assistant, Hanna Seydel, from Germany, on the StoryCenter websites with the Hyperlinked Library.  Her professional journey into storytelling within urban planning started with a realization that storytelling was an overlooked aspect of her field of study. Seeking to integrate storytelling as a participatory method in urban planning, I began to read the fascinating storytelling that shows the true essence and significance of storytelling for Seydel to start her journey with the StoryCenter to comprehend the fundamental elements of storytelling and its mechanisms and master the art of storytelling firsthand.

Through this immersion, reading more profoundly into the intricate interplay between stories and spatial dynamics is inspiring. It fosters a curiosity about how storytelling facilitates our understanding, engagement, and interaction with diverse geographical locations. Exploring the Stories-in-Motion workshop, a recent addition to the StoryCenter public workshop program, seamlessly integrates this approach, bridging my curiosity at a cat pawning her way through the research interests with the ethos of StoryCenter. I read the Stories-in-Motion workshop in the spring of 2021, which followed the researcher’s expedition to Berkeley during the summer of the same year. This experience enriched my understanding of storytelling’s role in urban environments, and I share insights from it and my interactions with fellow participants (Hill, 2021).

As I learn more about the StoryCenter writers as the flourishing interest in the mixture of maps and narratives, the concept of a “story map” emerges as a prominent term, reflecting the evolving discourse surrounding this intersection (Caquard 2013: 137). This trend is evidenced by the number of papers and blogs discussing maps presented in diverse narrative plans.

The hyperlinked library’s participants or viewers engage with modern advancements in story mapping tools by ArcGIS and Google Maps, signifying a paradigm shift in visual storytelling. Esri’s (ArcGIS) innovative tool for creating “georeferenced” story maps offers a range of pre-designed templates, empowering individuals to craft personalized narratives. “ArcGIS Story Maps” seamlessly integrate authoritative maps with textual, visual, and multimedia content, amplifying the potential of geography to convey compelling narratives across various contexts, from advocacy and outreach to virtual tours and public information dissemination (Szukalski, B.; Carroll, A.,2020). Having had the opportunity to learn more about the Stories-in-Motion workshop during the spring of 2021, I share these powerful stories by reading about the researchers who participated in exploration during a research trip to Berkeley in the summer of the same year. I gained insights from the workshop experience and interactions with fellow participants or viewers in this reflection and my blog post. After immersing myself in Hill’s Stories-in-Motion workshop (SiM-Workshop), I was inspired to integrate its methodologies into the StoryCenter public workshop program, marking a significant addition.

This adaptation allowed me to narrate alternative storytelling with my blog interests using StoryCenter’s narrative-focused approach. After writing my blog post about the Stories-in-Motion workshop in the spring of 2021, I was further privileged to read the materials from the research conducted in the Bay Area during the summer of the same year. In addition to reading, Caquard highlights the term “story map” as emblematic of the expanding intersection between maps and narratives (Caquard 2013: 137).

These exceptional scholarly papers and online discussions explore maps embedded within diverse narrative formats. The emergence of new story mapping tools such as ArcGIS and Google Maps underscores this trend. Esri (ArcGIS) has developed a novel tool for crafting called “georeferenced” story maps from the StoryCenter website that offers users a selection of templates for tours, cascades, journals, series, or shortlists (Admin, 2024). These tools empower individuals to create tailored story maps seamlessly. According to Szukalski and Carroll in 2020, “ArcGIS Story Maps enables users to integrate authoritative maps with text, images, and multimedia content, facilitating the seamless utilization of maps and geography in narrative storytelling.” Such Story Maps find versatile applications, ranging from advocacy and outreach to virtual tours, travelogues, public information dissemination, and beyond (Szukalski & Carroll, 2020).

As I researched deeper into StoryCenter, I encountered the “burgeoning” interest in merging maps with narratives, symbolized by the concept of a “story map.” This term reflects the evolving discourse surrounding the convergence of maps and narratives, which is evident in numerous scholarly papers and online discussions. The emergence of modern story mapping tools, such as ArcGIS and Google Maps, signifies a paradigm shift in visual storytelling. ArcGIS’s innovative tool for crafting georeferenced story maps offers many pre-designed templates, empowering individuals to create tailored narratives seamlessly. As Szukalski and Carroll (2020) articulated, “ArcGIS Story Maps enables users to integrate authoritative maps with text, images, and multimedia content, facilitating the seamless utilization of maps and geography in narrative storytelling.” These Story Maps find versatile applications, ranging from advocacy and outreach to virtual tours, travelogues, and public information broadcasting or social media platforms.

Reading the Stories-in-Motion workshop and its methodologies inspired me to integrate them into the StoryCenter public workshop program that can work with the hyperlinked library, marking a significant development in the workshops. This adaptation allowed me to align my research interests with StoryCenter’s narrative-focused approach. Furthermore, my blog post about the workshop in the spring of 2021 provided insights into the research conducted in the Bay Area during the subsequent summer, enriching my understanding of storytelling’s applications in diverse contexts.

References:

Admin. (2024, January 29). StoryCenter geolocation projects. StoryMapping. https://wp.story-mapping.org/

Caquard, S. (2013). “Cartography I: Mapping narrative cartography,” Progress in Human Geography, 37(1), 135-144.

Hill, A. (2021, August 27). Stories in motion: How stories shape our relationship with space. https://www.storycenter.org/storycenter-blog//stories-in-motion-how-stories-shape-our-relationship-with-space

Lambert, J.; Hessler, B. (2018). Digital Storytelling: Capturing Lives, Creating Community. Milton.

Szukalski, B.; Carroll, A. (2020). The Myriad Uses of StoryMaps. https://storymaps.arcgis.com/stories/1b38cf02f39849478d3123dcd9465022

Recommended Reading Materials:

Chancellor, R., & Lee, S. (2016). “Storytelling, oral history, and building the library community,” Storytelling, Self, Society, 12(1), 39-54.

Moenandar, S.-J.; Wood, L. (2017). “Stories of Becoming. The Use of Storytelling in Education, Counselling and Research.” Nijmegen.

Ricoeur, P. (1986) “Life. A Story in Search of a Narrator,” in Doeser, M.C.; Kraay, J.N. (Hrsg.), Facts and Values. Dordrecht, 425-437. = 19.

**Please note this reflection is based on Storytelling people who share their stories with librarians

1 Comment

  1. Michael Stephens

    Frances – This was so interesting! I appreciate your jumping off point to bring all these “storied” ideas to life.

Leave a Reply

The act of commenting on this site is an opt-in action and San Jose State University may not be held liable for the information provided by participating in the activity.

Your email address will not be published. Required fields are marked *